
Savings you can
defend in a review.
Claiming a saving is easy. Proving one against a building that changed occupancy, weather and operating hours over the same period is the hard part — and it is the only version a finance team will accept. This is a full IPMVP module, not a chart with a line on it.
A building that changed is not a fair comparison.
Last year against this year tells you almost nothing. The weather moved, occupancy moved, operating hours moved. A baseline model holds those constant so what is left is the thing you actually changed.
- Regressed on the drivers that move consumption in that building
- Climate and operational drivers, single or multivariate
- Outliers flagged statistically, not deleted because they were inconvenient
- The regression, the variables and the fit all open to inspection
Illustrative. The fitted model, its variables and its goodness of fit are all inspectable in the platform.
What the evidence looks like.
Three views, in the order a saving has to survive them — registered, modelled, then verified against what the meter actually read.
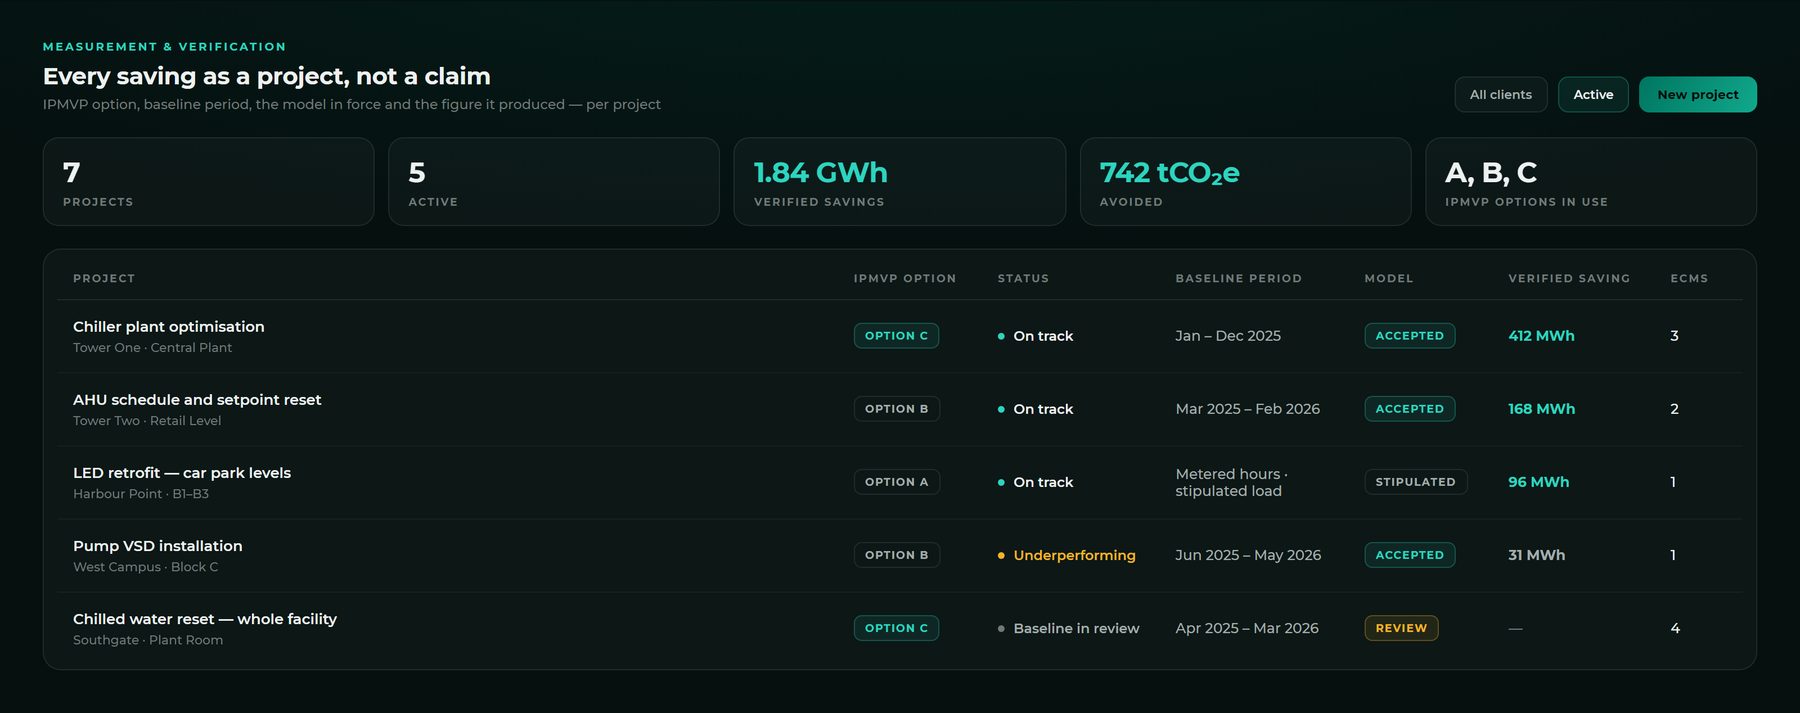
Every saving is a project, not a claim.
IPMVP option, baseline period, the model in force and the figure it produced — visible per project, so a number can always be traced back to how it was arrived at.
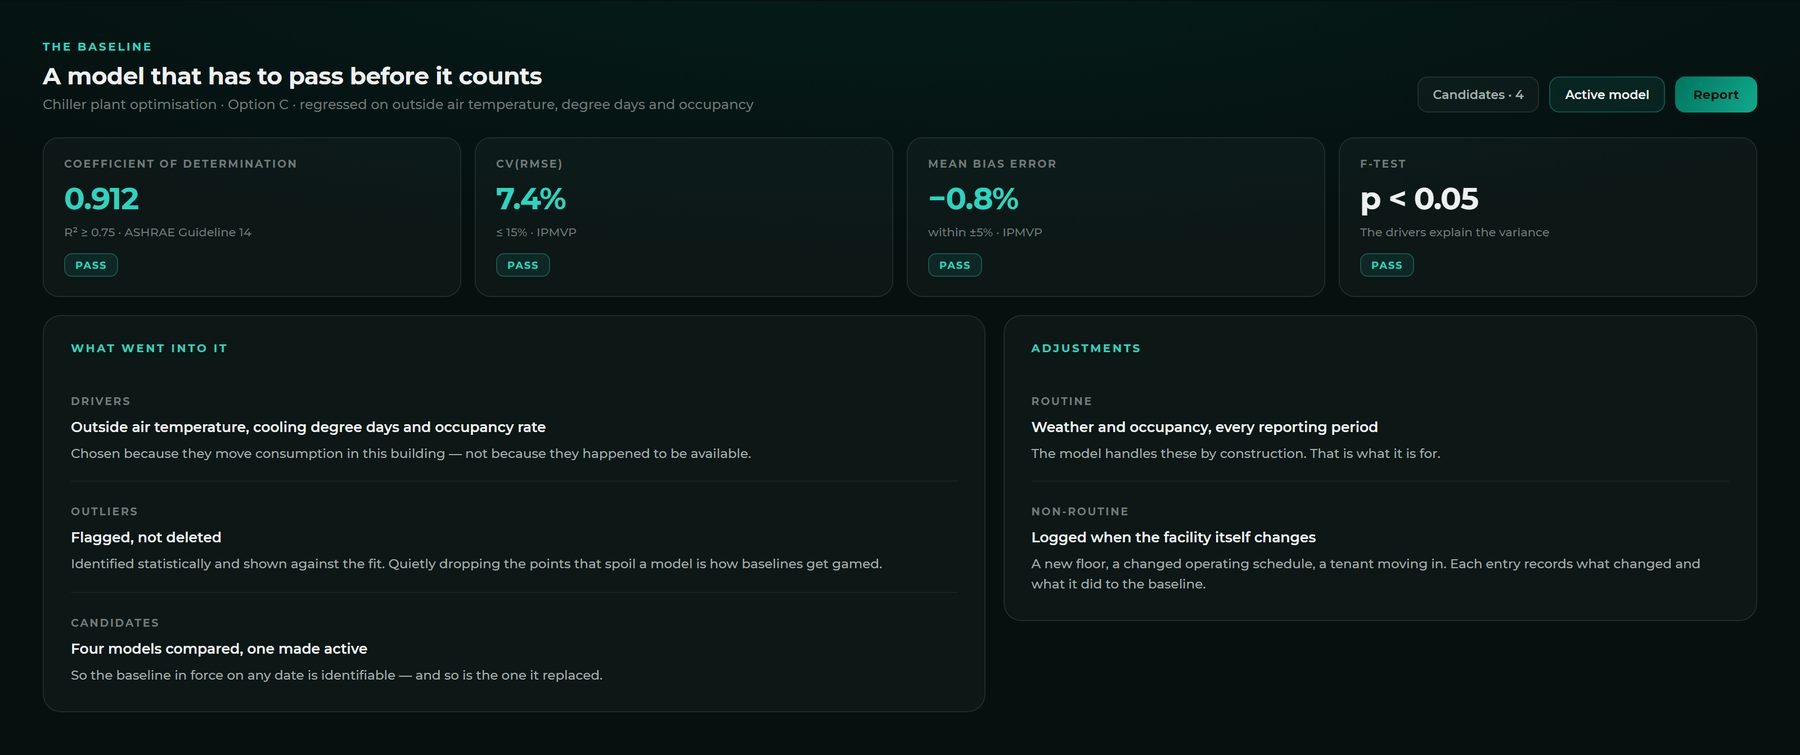
A model that has to pass before it counts.
R², CV(RMSE), mean bias error and an F-test, each scored against its published acceptance threshold. A model that fails is shown as failing rather than quietly used anyway.
Avoided energy, against what the meter actually read.
The model says what the building would have used. The meter says what it did use. The gap is the saving — and the cost and carbon figures are that same number priced and converted, not a second calculation.
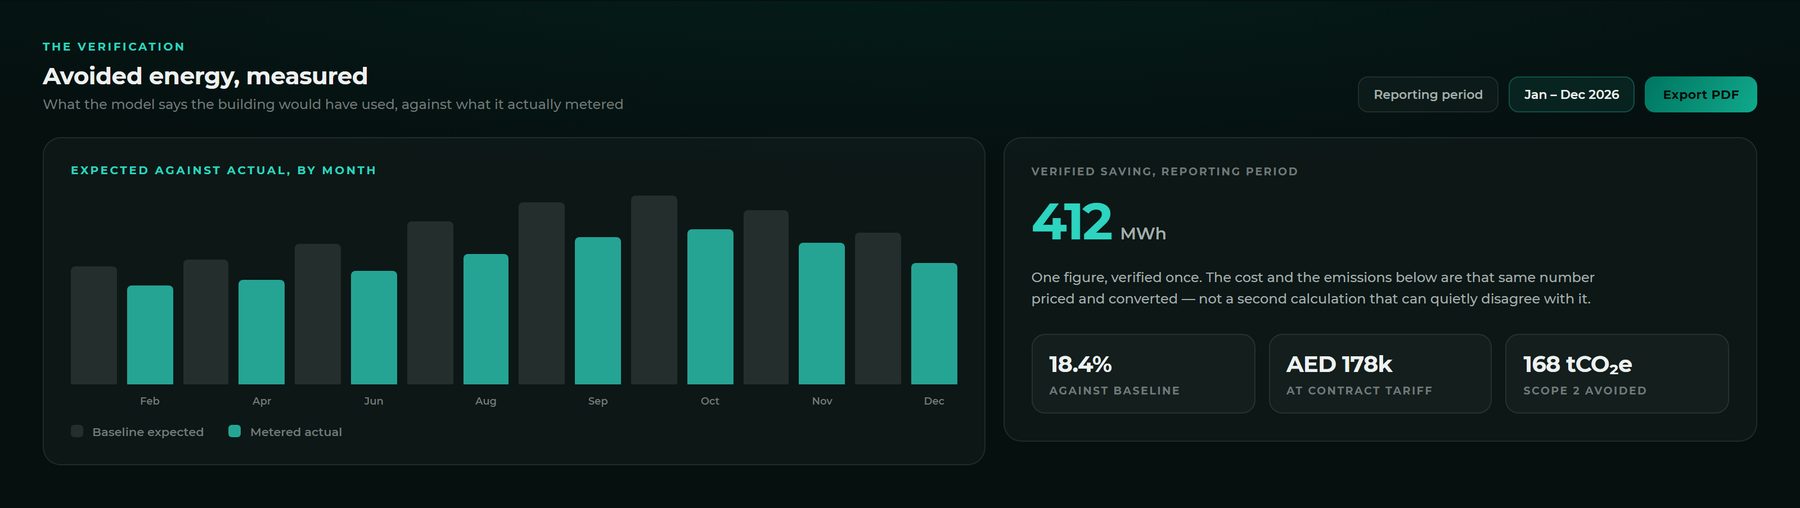
Interface representative. Figures are illustrative demonstration data. For the continuous picture — consumption, cost and carbon across the estate — see energy management.
Measurement and verification, done to the standard
- IPMVP Option A, B or C — retrofit isolation, partially measured, or whole facility
- Baseline period built from metered interval data or an uploaded dataset
- Regression against the drivers that actually move consumption, single or multivariate
- Climate drivers — outside air temperature, cooling and heating degree days, solar irradiance, humidity, wet bulb
- Operational drivers — occupancy rate and production volume
- Outliers identified statistically — studentized residuals and Cook’s distance — not removed because they looked wrong
- R², CV(RMSE) and mean bias error, each scored against its acceptance threshold and shown as pass or review
- Avoided energy measured as the model’s expected consumption against metered actual
- Candidate models compared and one made active, so the baseline in force is always identifiable
- Routine and non-routine adjustments where the facility itself has changed
- Projects tracked as on track or underperforming, not simply open or closed
- Tariff and carbon factors per country, with the source of each factor stated
- Savings expressed in energy, cost and emissions from the same verified figure
- A reporting-period PDF you can hand to finance or an auditor
The regression, the variables chosen and the fit are all visible. A baseline you cannot inspect is not evidence — it is a different kind of estimate.
Proof, not a percentage in a deck
The baseline, the drivers, the fit and the adjustments are all visible — so the saving survives a hot summer, a change of occupancy and a finance review.